I don't know about you, but in my almost decade of software development a good chunk of my job has always been weeding through log files.
I regularly need to get summarized metrics out of log files. There are some great tools you probably already know for the common search/discovery tasks (grep, silver searcher ag, awk, etc). Lately, I've needed things like request timings broken down by route, or average time spent calling the database by query parameters.
I can do this with existing tools (even as simple as zcat | grep | sort | uniq, and deriviations thereof), but I need to wait for the entire set to be computed before seeing results. Something like awk is a bit more powerful, but it's a lot to write when you need to slice data by a relatively common use-case.
This is where rare comes in.
Github: https://github.com/zix99/rare
Binary releases: https://github.com/zix99/rare/releases
What is Rare?
Rare's name is a play on regex and more/less. Rare does fast, line-based realtime regex-extraction, and aggregation into common formats such as histograms, numerical summaries, tables, and more!
Once a regex extracts the groups, there is a handlebars-like expression syntax to allow grouping, readibility enhancements, and comparisons.
Features
- Multiple summary formats including: filter (like grep), histogram, tables, and numerical analysis
- File glob expansions (eg
/var/log/*or/var/log/*/*.log) and-Rfor recursion - Optional gzip decompression (with
-z) - Following
-for re-open following-F(use--pollto poll) - Ignoring lines that match an expression with
-i - Aggregating and realtime summary (Don't have to wait for all data to be scanned)
- Multi-threaded reading, parsing, and aggregation
- Color-coded outputs (optionally)
--nocoloror--color - Pipe support (stdin for reading, stdout will disable color) eg.
tail -f | rare ... - Extracting values from JSON with the
{json}expression
Example: Parsing nginx logs
Let's take a look at an example.
Let's say we have a traditional nginx access log. It probably looks something like this:
209.15.211.12 - - [14/Apr/2016:18:13:29 +0200] "GET /mirror/server.cfg HTTP/1.1" 206 101 "-" "curl/7.43.0"
209.15.211.12 - - [14/Apr/2016:18:13:38 +0200] "GET /mirror/server.cfg HTTP/1.1" 206 100 "-" "curl/7.43.0"
107.182.132.11 - - [14/Apr/2016:18:15:46 +0200] "GET / HTTP/1.1" 200 1021 "-" "Mozilla/5.0 (Windows NT 6.2; WOW64) AppleWebKit/537.4 (KHTML, like Gecko) Chrome/98 Safari/537.4 (StatusCake)"
There's some good information in there. Let's say we want to better understand the distribution of status codes. We can write a regex like this to extract it: " (\d{3}). Let's apply that to rare's matcher -m.
$ rare histo -m '" (\d{3})' access.log
" 200               160,681
" 404               860
" 304               53
" 403               14
" 301               12

Matched: 161,622 / 161,622
Groups:  6
That's great, but since part of the regex was matching the first ", we got that as a result. This is where expressions come in. We want to select the first match group as our output with -e.
$ rare histo -m '" (\d{3})' -e '{1}' access.log
200                 160,681
404                 860
304                 53
403                 14
301                 12

Matched: 161,622 / 161,622
Groups:  6
That's better. Now let's remove the 200 response code, because I want to focus in on the other types. We'll use --ignore or -i for this. It will ignore a line if it evaluates the expression to be non-empty (truthy). I've also thrown on -b to get a bars-visualization of the results to quickly understand distribution.
$ rare histo -m '" (\d{3})' -e '{1}' -i '{eq {1} 200}' -b access.log
404                 860        ||||||||||||||||||||||||||||||||||||||||||||||||||
304                 53         |||
403                 14
301                 12
206                 2

Matched: 941 / 161,622 (Ignored: 160,681)
Groups:  5
Great! Now let's really focus in on this. Let's pull out the method and path with another regex: "(\w{3,4}) ([A-Za-z/.]+).*" (\d{3})
You'll also note I changed the extraction expression -e and -i to the appropriate match group indexes.
$ rare histo -m '"(\w{3,4}) ([A-Za-z/.]+).*" (\d{3})' -e '{3} {1} {2}' -i '{eq {3} 200}' -b access.log
404 GET /robots.txt                728        ||||||||||||||||||||||||||||||||||||||||||||||||||
404 GET /favicon.ico               109        |||||||
304 GET /                          52         |||
301 GET /mirror                    11
403 GET /mirror/distros/cup/       7

Matched: 941 / 161,622 (Ignored: 160,681)
Groups:  23
Looks like robots.txt and favicon are our main cuplrits for missing files.
Now let's have some fun.. let's see which IPs get the most non-200 error codes. (IP's tweaked to keep anonymitiy)
$ rare table -m '([0-9\.]+).*"(\w{3,4}) ([A-Za-z/.]+).*" (\d{3})' -e '{tab {4} {1}}' -i '{eq {4} 200}' access.log
               404            304            403            301            206
77.88.47.6     397            14             0              0              0
5.255.250.94   50             1              0              0              0
100.43.81.133  33             0              0              0              0
208.58.208.13  23             0              3              1              0
77.88.47.89    18             0              0              0              0
77.88.5.9      17             0              0              0              0
209.190.211.28 7              0              0              5              2
180.76.15.147  9              3              0              0              0
84.201.133.42  10             0              0              0              0
93.158.161.28  9              0              0              0              0
180.76.15.11   8              0              0              0              0
73.149.131.189 6              0              0              2              0
180.76.15.143  5              2              0              0              0
180.76.15.145  6              1              0              0              0
180.76.15.6    7              0              0              0              0
173.48.198.132 0              0              6              0              0
180.76.15.140  5              1              0              0              0
180.76.15.148  6              0              0              0              0
180.76.15.163  5              1              0              0              0
Matched: 941 / 161,622 (Ignored: 160,681)
Rows: 127; Cols: 5
Expressions
There's a lot more documentation on expressions on github or if you run rare docs expressions, but needless to say they're the easiest way to summarize and aggregate the output.
It's handlebars-like (just one brace instead of two), and has many built-in helpers for arithmatic, equality-checking, json parsing, and some nicer things like bytesize formatting.
eg {bytesize 1024} will output 1 KB. You can take this further like {bytesize {add {1} {2}}} to add two match-groups together and output the bytesize.
Bucketing
For histograms, a common desire might be to bucket a given value. This is useful, for instance, to get a sense of what file sizes are being returned in the logs.
Let's take a look at another example:
Look at all requests file size, ignore the 0 bucket (My log has a disproportionate number of 0's in it), and format with byte-size.
$ rare histo -m '" (\d{3}) (\d+)' -e '{bytesize {bucket {2} {multi 1024 1024}}}' -n 20 -b -i '{eq {bucket {2} {multi 1024 1024}} 0}' access.log
1 MB                796        ||||||||||||||||||||||||||||||||||||||||||||||||||
2 MB                540        |||||||||||||||||||||||||||||||||
4 MB                300        ||||||||||||||||||
6 MB                251        |||||||||||||||
8 MB                231        ||||||||||||||
5 MB                229        ||||||||||||||
3 MB                192        ||||||||||||
9 MB                192        ||||||||||||
11 MB               179        |||||||||||
14 MB               172        ||||||||||
7 MB                163        ||||||||||
16 MB               158        |||||||||
10 MB               150        |||||||||
20 MB               142        ||||||||
21 MB               123        |||||||
32 MB               94         |||||
13 MB               88         |||||
35 MB               86         |||||
59 MB               79         ||||
17 MB               76         ||||

Matched: 7,395 / 161,622 (Ignored: 154,227)
Groups:  210
Performance
One of the goals at the start was to have this tool be comparible in performance to something like silver-searcher ag, and grep. Understanding that this tool does a bit of a different job as those, some leeway was given. Golang has an awesome parallelization toolkit (channels, etc), so that was taken advantage of and optimizations were done on top of that.
By default, multiple workers (go-routines) are responsible for reading (and optionally decompressing) the logs, and then more workers are responsible for running the regex and expression-builder on top of the batch of results.
Benchmarking
It's worth noting that in many of these results rare is just as fast, but part of that reason is that it consumes CPU in a more efficient way (go is great at parallelization). So take that into account, for better or worse.
All tests were done on ~200MB of gzip'd nginx logs spread acorss 10 files.
Each program was run 3 times and the last time was taken (to make sure things were cached equally).
Profiling
As part of optimization, I ran rare with --profile to hook in golang's pprof profiler. I ended up optimizing some IO by leveraging channel batching, and implementing a read-ahead buffer, along with using byte arrays rather than strings almost everywhere for the data (Less memory copying). Overally, I was able to get rare faster than ag, and darn close to grep.
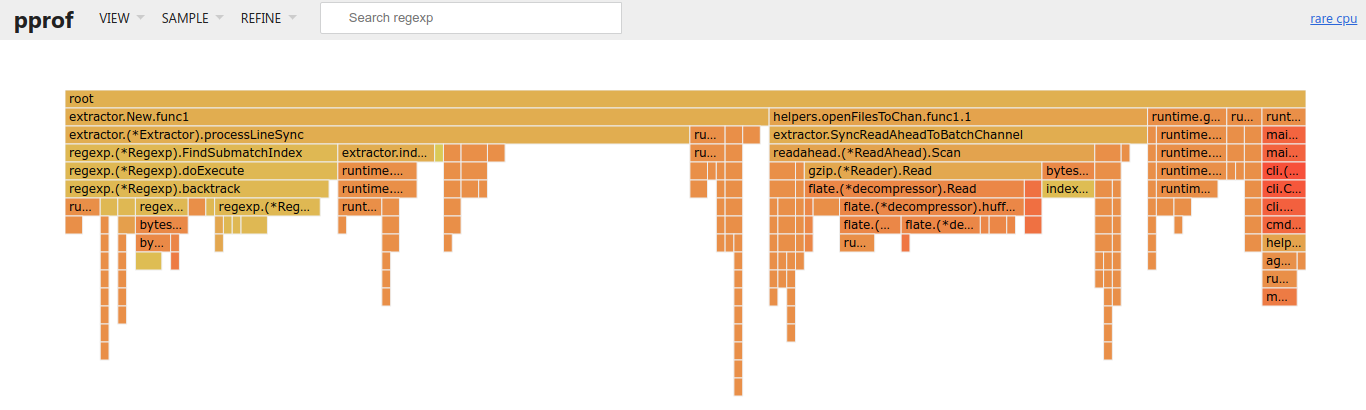
About 40% of the time is taken from things out of our control (Regex and file io/decompression). Work has been done to optimize heap allocation, though that did shift some responsibility to the functions (which is why things like processLineSync takes some time).
Comparing Results
I've tried to make each set of commands equivalent to each other. Each will output the same results, and have the same meaning.
zcat & grep
$ time zcat testdata/* | grep -Poa '" (\d{3})' | wc -l
1131354

real    0m0.990s
user    0m1.480s
sys 0m0.080s

$ time zcat testdata/* | grep -Poa '" 200' > /dev/null

real    0m1.136s
user    0m1.644s
sys 0m0.044s
I believe the largest holdup here is the fact that zcat will pass all the data to grep via a synchronous pipe, whereas
rare can process everything in async batches. Using pigz instead didn't yield different results, but on single-file
results they did perform comparibly.
Silver Searcher (ag)
$ ag --version
ag version 0.31.0

Features:
  +jit +lzma +zlib

$ time ag -z '" (\d{3})' testdata/* | wc -l
1131354

real    0m3.944s
user    0m3.904s
sys 0m0.152s
rare
$ rare -v
rare version 0.1.16, 11ca2bfc4ad35683c59929a74ad023cc762a29ae

$ time rare filter -m '" (\d{3})' -e "{1}" -z testdata/* | wc -l
Matched: 1,131,354 / 3,638,594
1131354

real    0m0.927s
user    0m1.764s
sys 0m1.144s

# A slightly different command to show the power of parallel aggregation
$ time rare histo -m '" (\d{3})' -e "{1}" -z testdata/*
200                 1,124,767
404                 6,020
304                 371
403                 98
301                 84

Matched: 1,131,354 / 3,638,594
Groups:  6

real    0m0.284s
user    0m1.648s
sys 0m0.048s
Histo is significantly faster.. mostly because less synchronois io (wc -l) is occurring. The main take-away is that filter (which is most comparible to grep) takes similar real-time, and slightly more cpu-time.
And don't forget.. it was giving you the results to your terminal as it was building them! Unlike the other commands, you didn't have to wait until completion.
Summary
I hope you find this tool, and what it's trying to accomplish, beneficial to your workflow. Always happy to field any questions (either below, or on its github page).